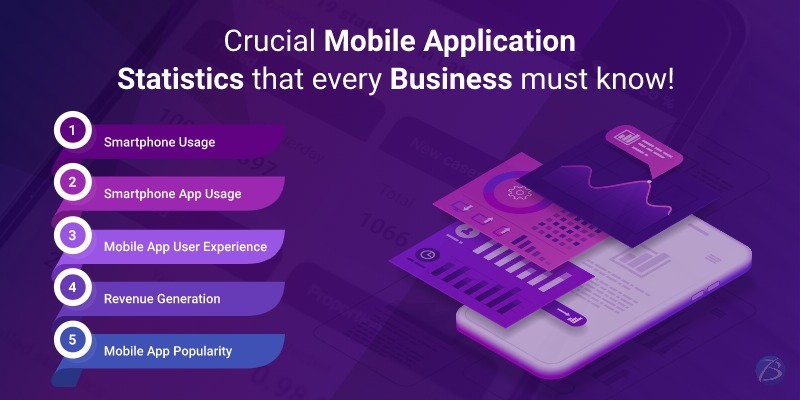
Crucial Mobile Application Statistics that every Business must know!


Food for thought:
How much time is spent on smartphone apps each day?
What is the amount of revenue generated by smartphone applications per year?
What is the future prediction for mobile app usage?
The answers to the aforesaid questions will guide entrepreneurs who intend to develop a mobile app for business promotion. For this reason, I have listed down the most vital mobile app industry statistics and trends until2021. Reading this article will provide businesses clear visibility of user behavior. This will help them to ensure that their mobile app aligns with the current trends and expectations of their target audience.
Important Mobile App Industry Statistics and Trends until 2021

Take a look at the mobile app statistics and trends of 2020 based on the following parameters.
1. Smartphone Usage
Number of Smartphone Users (Statista):
2020 witnessed 6.95 billion smartphone users across the globe. This number is predicted to shoot up to 7.1 billion in 2021 and reach 7.41 billion by the year 2024.
Average time spent on Mobiles (App Annie)
The average time spent on smartphones daily was 3.40 hours in 2019 which is 35% higher than the average hours recorded in 2017. This means mobile users spent 25% of their active hours on smartphones.
Organic Search Engine Visits (Statista)
As of 2020, 56% of the organic search engine visits in the US came from smartphone devices.
Smartphone: The most preferred medium for internet usage Statista
The total number of active internet users was 4.66 Billion in October 2020, which accounted for 59% of the world population. Interestingly, the number of mobile internet users comprised 91% of the total digital population.
Inference: With the growing number of mobile internet users, it is advisable to make your brand accessible in the mobile space as well. Remember, new-age users, conduct their research first on their smartphones before using a tablet, desktop, or laptop.
2. Smartphone App Usage
Amount spent on mobile apps (Statista)
By 2025, the total expenditure on mobile apps by consumers around the world is expected around 85 Billion USD.
Rising popularity of mobile apps eMarketer

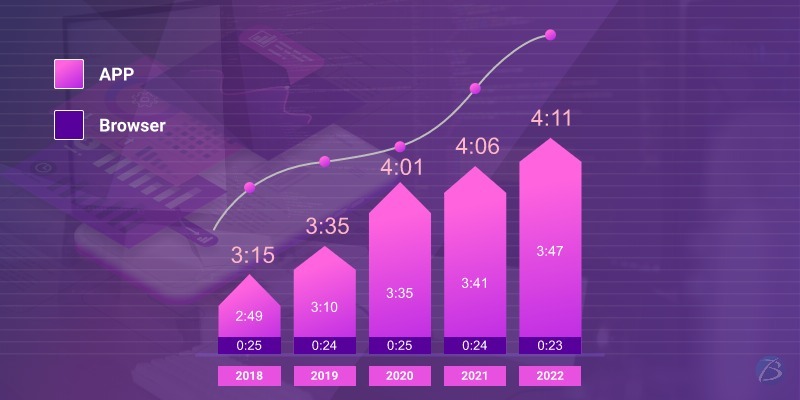
Smartphone users are spending lesser time on mobile browsers and more time on apps and this gap have been widening with time. As in 2020, users spent more than 90% of their mobile time in apps. (Out of 4.1 hours spent on smartphones; 3.35 hours were spent on apps and only 0.25 hours were spent on browsers).
Inference: App creators need to adopt a mobile-first strategy. It is important to optimize websites for mobiles and build responsive and custom apps.
3. Mobile App User Experience
Speed matters:
59% of consumers prefer making purchases from brands that provide quick services. Refer to guide for more details.
App usage frequency: Social Media Today
Users on average have 80 apps installed on their smartphones but use only 9 apps daily and 30 apps per month.
Reasons for app Uninstall: Clevertap
Why do users uninstall an app? Check out the reasons along with the percentage of uninstalls.
· App not in use for a long time: 39.9%
· Limited storage: 18.7%
· Too many Advertisements: 16.2%
· Unwanted notifications: 12.6%
· Confusing: 5.4%
· Technical hiccups: 5.4%
· Others: 1.6%
Inference: Most users uninstall an app because of not using it for a long time and an app is less frequently used due to waning interest. Therefore, developing an app is just not enough to retain customers. App owners must continually upgrade their app with the latest features and innovative functions to cope up with changing times and keep users engaged. Additionally, smart strategies should be devised to make your app a part of the users’ daily smartphone activity. Moreover, to ensure speedy online purchasing, eCommerce apps must be easy to operate without too many complicated steps.
4. Revenue Generation
Revenue via in-app advertising and paid downloads: Statista
As per a report published in Feb4, 2021, the mobile app revenue generated globally through in-app advertising and paid app downloads was 365.2 Billion USD in the year 2018. This figure rose to 581.9 Billion USD in 2020 and is expected to cross 935 Billion USD by 2023.
Inference: Possessing a paid app may sound daunting, but fetches you revenue if your brand satisfies customer expectations.
Ad Space Investment App Annie
The amount invested in mobile app ad spaces was 240 Billion USD in 2020 which is a 26% spike as compared to the previous year.
Several free mobile applications generate revenue for their brand via selling ad spaces. This strategy also benefits businesses without a mobile app. How? Brands without apps buy ad spaces offered by the popular free apps to establish their digital presence.
Inference: Buying and selling ad spaces is a smart business strategy indeed!
5. Mobile App Popularity
Most popular apps Mindsea
The most frequently used apps happen to be social media applications as they account for 69% of the total app usage; followed by messaging applications.
Android vs iOS: statcounter
Android OS accounts for 75.47% of the global market share while iOS accounts for 22.71%.
Inference: Contemporary users love social networking and app owners must consider integrating features that enable users to connect with people and be a part of communities. However, although Android has a greater market share than iOS, one should choose the OS based on the app's objective and target audience.
Final Words
So, before you hire mobile app developers to transform your app idea into reality, consider the aforesaid mobile application statistics and trends to choose the right strategy.
Looking for mobile application development services? Reach out to Biz4Solutions a prominent mobile app development company having 9+years of experience. Our skilled professionals will create a profitable app for your enterprise.
The core technologies we offer:
Other articles and publications:
- +1 (469) 277-0804
- 8305 Tripoli Trl, Frisco, TX 75034, United States
- www.biz4solutions.com/


